


-
- Plateformes de trading
- Application PU Prime
- MetaTrader 5
- MetaTrader 4
- PU Copy Trading
- Trader Web
- PU Social
-
- Conditions de Trading
- Types de compte
- Spreads, Coûts et Swaps
- Dépôts et Retraits
- Frais et Charges
- Heures de Trading

11 July 2025,07:18
Daily Market Analysis
11 July 2025, 07:18


Key highlights:
*Trade War Pressures Demand: Crude edges lower as U.S. escalates tariffs, including a 50% levy on Brazil, deepening global demand concerns.
*OPEC+ May Pause October Hikes: Producers weigh halting supply boosts after September amid growing market oversupply.
Crude oil prices slipped on Thursday as escalating global trade tensions weighed on demand prospects, while a potential pause in OPEC+ supply hikes helped limit further losses.
U.S.-led tariff pressures have intensified in recent days, with President Donald Trump’s fresh 50% import tax targeting Brazil and signaling renewed friction with other key trade partners. Earlier trade breakthroughs with China and the UK have been overshadowed, triggering renewed concerns over global growth and commodity demand.
Despite the bearish macro backdrop, downside pressure on oil was partially offset by reports that OPEC+ is considering halting production increases after its next scheduled hike in September. Delegates familiar with the matter said a pause may take effect from October to prevent a deeper market surplus.
Saudi Arabia and its allies plan to complete a 2.2 million barrel-per-day supply revival by September, capping it with a final monthly tranche of 550,000 barrels. However, a combination of weakening Chinese demand, record U.S. output, and rising stockpiles have sparked concern within the group.
According to the International Energy Agency (IEA), global inventories have been climbing at a pace of 1 million barrels per day. This build-up could lead to a fourth-quarter surplus equivalent to 1.5% of global oil consumption—prompting OPEC+ to reconsider additional output.
Technical Analysis
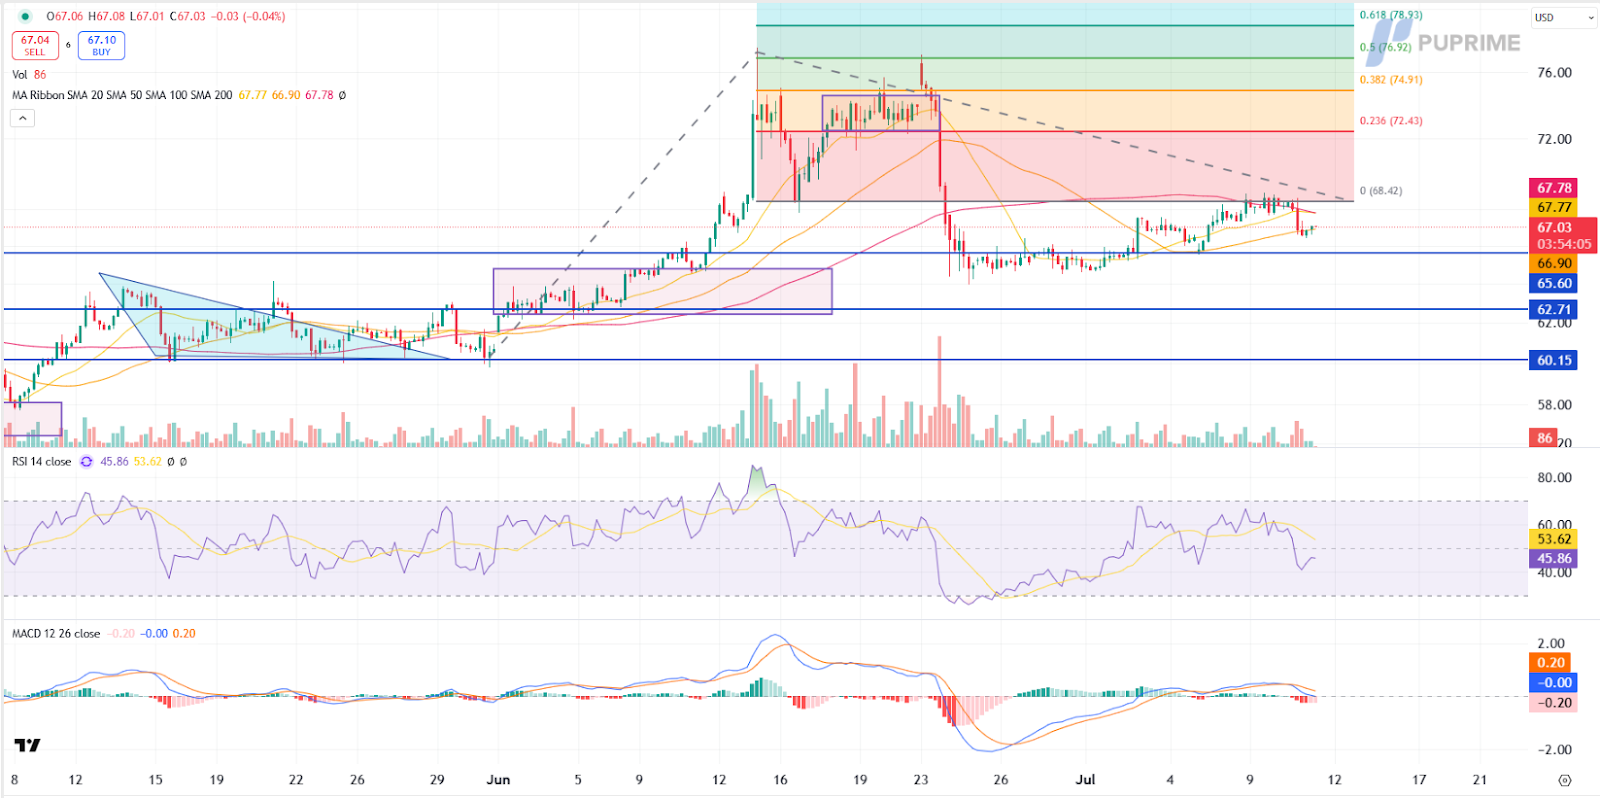
Crude Oil, H4:
Crude oil remains under pressure but appears to be stabilizing as prices test the key support level around 65.60.
The MACD indicator suggests that bearish momentum is gradually fading, potentially indicating a slowdown in selling pressure. Meanwhile, the Relative Strength Index (RSI) is hovering near 46, signaling that the market is approaching neutral territory but has not yet entered oversold conditions.
If prices hold above the 65.60 support level, a short-term rebound toward the next resistance at 68.40 could be expected. However, a confirmed break below support would open the door for a deeper retracement, with 63.90 as the next key downside target. Momentum indicators suggest the market may enter a consolidation phase unless a clear directional catalyst emerges.
Resistance levels: 68.40, 72.45
Support levels: 68.40, 65.60

Tradez le Forex, les indices, Métaux et plus encore avec des spreads faibles et une exécution ultra-rapide.
Inscrivez-vous pour un compte réel PU Prime grâce à notre procédure simplifiée.
Approvisionnez facilement votre compte grâce à un large éventail de canaux et de devises acceptées.
Accédez à des centaines d’instruments avec les meilleures conditions de trading.
Plateformes de trading
Apprendre
À propos de PU Prime
Corporatif
