PU Prime App
Exclusive deals on mobile


PU Prime App
Exclusive deals on mobile
Tenir les marchés mondiaux entre vos mains
Notre application de trading pour mobile est compatible avec la plupart des appareils intelligents. Téléchargez l’application dès maintenant et commencez à trader avec PU Prime sur tout appareil, à tout moment et en tout lieu.


6 June 2023,05:56
Daily Market Analysis
6 June 2023, 05:56


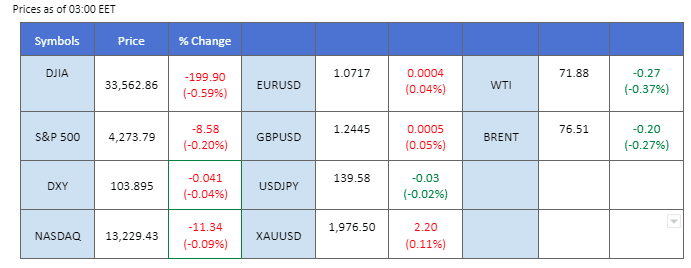
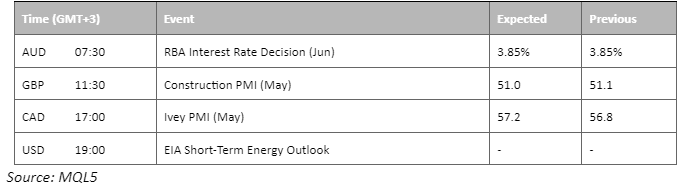
The dollar’s value experienced a decline, falling below $104 following the release of disappointing U.S. service PMI data. The reading dropped from 51.9 to 50.3, prompting the market to reconsider the possibility of the Federal Reserve pausing its interest rate hike in June. Investors are currently awaiting the announcement from the Reserve Bank of Australia (RBA), with the prevailing consensus suggesting that the Australian central bank will maintain its current monetary policy. However, if the RBA surprises the market by raising interest rates, it could strengthen the Australian dollar. On the other hand, oil prices have nearly erased all the gains made from the announcement of OPEC+ oil production cuts. The pessimistic outlook for oil demand has overshadowed the impact of the supply cuts.
Current rate hike bets on 14th June Fed interest rate decision:
Source: CME Fedwatch Tool
0 bps (78%) VS 25 bps (22%)
The dollar dropped after the latest report from the Institute for Supply Management (ISM), revealing a concerning slowdown in the US services sector, indicating near-stagnation in May. The overall gauge of services activity unexpectedly dropped to its lowest level of the year, reflecting a less optimistic outlook for the US economy. The news sparked a retracement in the dollar’s value as market participants reevaluated their expectations amid the subdued services data.
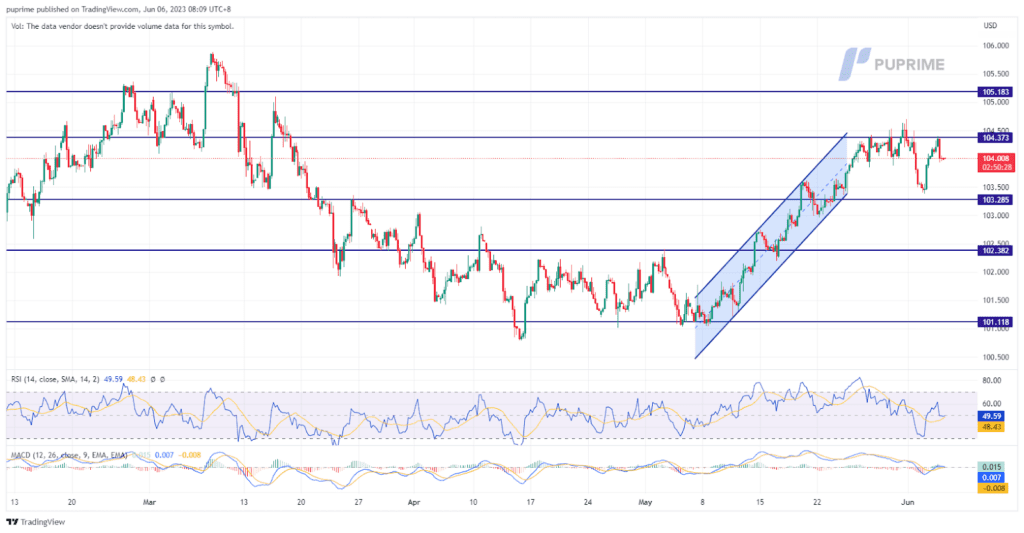
The dollar index has maintained a stable overall trend, fluctuating from 103.2 to 104.4. The RSI and MACD indicators indicate that the dollar index still exhibits bullish momentum in its trading activities.
Resistance level: 104.35, 105.20
Support level: 103.30, 102.40
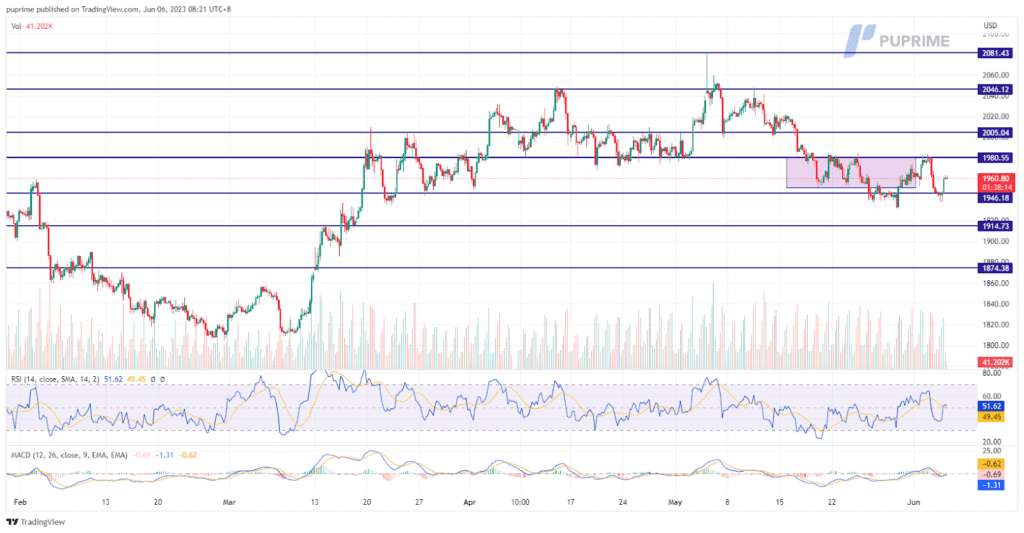
Gold prices recorded a gain of 0.89%, reaching $1960 per ounce, primarily driven by a weakening dollar. The decline in the dollar’s value has supported the precious metal, as a weaker currency typically makes gold more attractive to investors. Despite the recent increase, gold continues to trade within a stable range, oscillating between $1946 and $1980. It suggests a relatively consolidated market with little fluctuations.
In addition to the positive price movement, the MACD and RSI indicators signal a potential bullish divergence in gold prices. The MACD, which measures the momentum of price movements, shows a divergence between the price trend and its signal line, suggesting a possible shift towards upward momentum. Similarly, the RSI, which indicates overbought or oversold conditions, also exhibits a bullish divergence. This convergence of technical indicators further supports the expectation of more bullish momentum in the gold market.
Resistance level: 1980.00, 2005.00
Support level: 1945.00, 1915.00
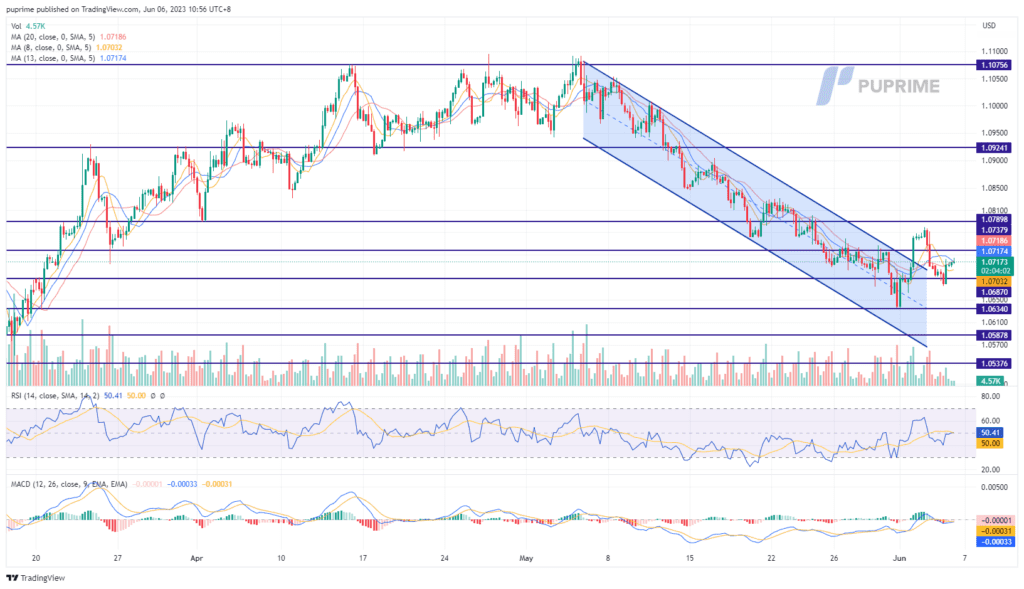
The release of the latest U.S. service PMI reading shows the country has relatively stagnant services sector activities. This prompted investors to rethink the possibility that the Fed may pause its rate hike in June, weakening the dollar. However, the euro continued to trade sideways as the inflation data of several European countries showed signs of easing; The ECB may not be as Hawkish as before in raising interest rates as the aggressive monetary policy may harm the stability of the financial system in the Euro as well.
EUR/USD is able to hold on above of its strong support level at 1.0680 and is traded out of the downtrend channel. Both the indicators show neutral signs for the pair with the RSI flowing near the 50-level while the MACD hover in between the zero line.
Resistance level: 1.0717, 1.0789
Support level: 1.0634, 1.0588
AUD/USD experienced a prevailing bullish momentum in June, especially after the strong U.S. dollar went at ease for the past week. The Aussie dollar gained more than 1% in the past week amid the U.S. facing the debt limit crisis. The Aussie dollar was further boosted by the disappointing U.S. services PMI data which dragged the dollar to trade below $104. Meanwhile, investors are awaiting for the RBA to announce its interest rate decision with the market consensus that the central bank will stand pat and hold its interest rate at 3.85%.
AUD/USD is suppressed by the strong resistance level at 0.6628. The RSI constantly flowing near the overbought zone depicts a strong buying power, but the MACD flows flat suggesting that the bullish momentum has eased.
Resistance level: 0.6628, 0.6690
Support level: 0.6610, 0.6500
The pound strengthened on Monday as upbeat economic data in the UK bolstered investor sentiment. The composite PMI and services PMI exceeded expectations, indicating a robust expansion in the country’s business activity. This upbeat performance contributed to the upward movement of the pound in the currency markets. Investors are now closely monitoring the release of construction PMI data today, as it could offer additional insights into the health of the UK economy and potentially influence trading decisions.
Both the RSI and MACD indicators are currently indicating a neutral momentum in the market. This neutral momentum suggests market participants may be cautious and await further signals before making significant trading decisions.
Resistance level: 1.2475, 1.2535
Support level: 1.2345, 1.2195
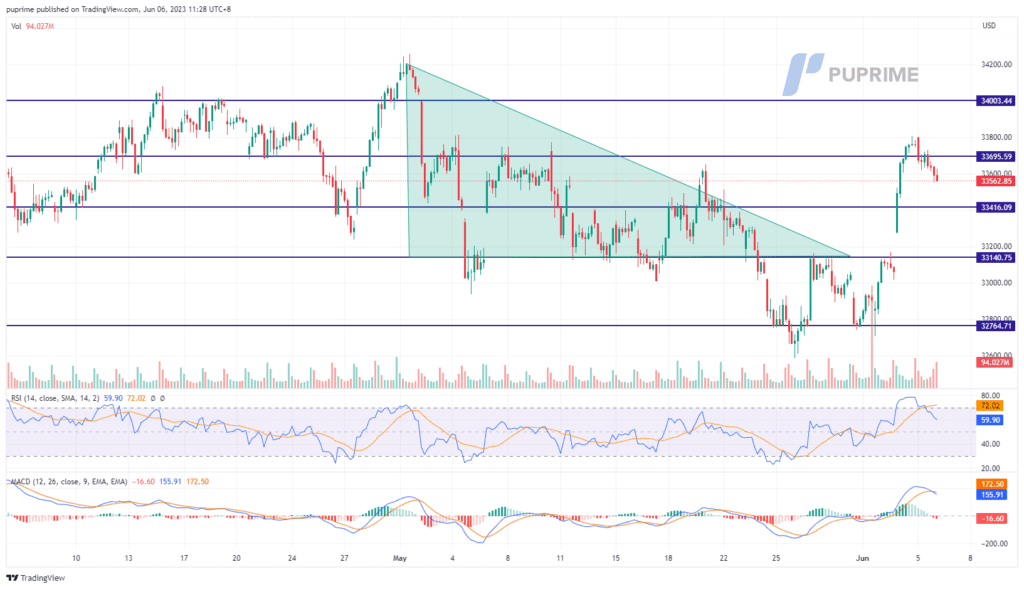
The Dow Jones Industrial Average fell 0.6% or 200 points. The index recorded a surge after optimism news from the debt-limit bill as well as robust jobs data reflecting the economy in the country remained hot. The index recorded a technical retracement despite the service PMI showing a decline from the previous reading, which increased the chance that the Fed may pause its June rate hike. Meanwhile, the market is still digesting the move of oil production cuts from OPEC+ and the regulation woes in the crypto market.
The Dow has experienced a technical retracement after a jump of more than 2% last Friday. Both indicators showed the Dow is still trading in a bullish momentum despite the RSI dropping out of the overbought zone while the MACD has eased above the zero line.
Resistance level: 33695.00, 34000.00
Support level: 33416.00, 33140.00
The announcement of deeper output cuts by Saudi Arabia fueled a surge in oil prices, reflecting positive market sentiment. However, today’s retracement suggests a temporary pullback in the market as profit-taking and cautious trading take place. This retracement has led to a decline in the stock prices of major oil companies such as Chevron and Exxon, which initially benefited from the higher oil prices. Traders and investors should closely monitor upcoming events, such as the US IEA energy outlook and crude oil inventory data, as they may provide valuable clues for future trading decisions in the oil market.
The current outlook for oil prices is expected to hover between $71 and $74 per barrel. It indicates a relatively tepid trading environment characterised by limited volatility and a lack of strong directional momentum. However, both the RSI and MACD indicators suggest that the oil prices still exhibit bullish momentum in its trading activities.
Resistance level: 74.20, 76.75
Support level: 71.00, 67.95

Tradez le Forex, les indices, Métaux et plus encore avec des spreads faibles et une exécution ultra-rapide.
Inscrivez-vous pour un compte réel PU Prime grâce à notre procédure simplifiée.
Approvisionnez facilement votre compte grâce à un large éventail de canaux et de devises acceptées.
Accédez à des centaines d’instruments avec les meilleures conditions de trading.
Plaquettes de trading
Entreprise
FAQs
Application PU Prime - Commencez à trader avec un avantage


Risk Warning: Contracts for Difference (CFDs) trading carries a high level of risk to your capital and can result in losses, you should only trade with money you can afford to lose. CFDs trading may not be suitable for all investors, please ensure that you fully understand the risks involved and take appropriate measures to manage them. Please read the relevant Risk Disclosure document carefully, available here: Legal Documentation.
PU Prime is a business name of PU Prime LLC. PU Prime LLC is registered in St. Vincent and the Grenadines with registration number: 271 LLC 2020, registered office at 1 Floor, First St Vincent Bank Building, James Street, Kingstown, St. Vincent and the Grenadines.
The information on this website is not directed to residents of certain jurisdictions such as the United States, Singapore, Australia, China, Russia and some other regions, and is not intended for distribution to, or use by, any person in any countries or jurisdictions where such distribution or use would be contrary to local law or regulation.
Copyright © 2024 PU Prime.
