


-
- Plateformes de trading
- Application PU Prime
- MetaTrader 5
- MetaTrader 4
- PU Copy Trading
- Trader Web
- PU Social
-
- Conditions de Trading
- Types de compte
- Spreads, Coûts et Swaps
- Dépôts et Retraits
- Frais et Charges
- Heures de Trading

19 June 2025,10:57
Chart The Market
19 June 2025, 10:57

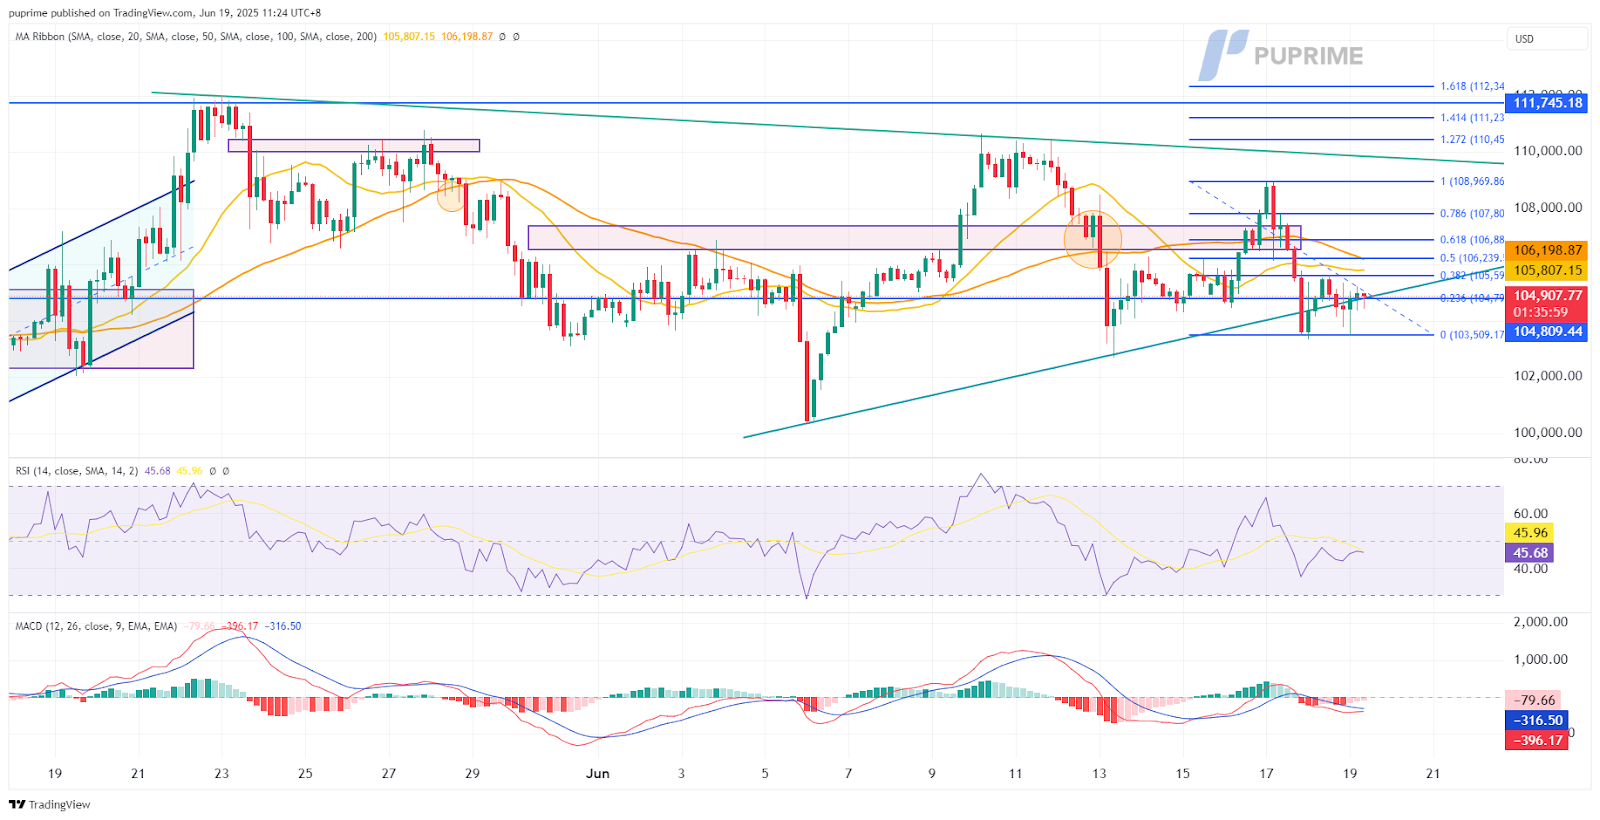
BTCUSD, H4:
BTC/USD continues to trade within a converging triangle structure, hovering near the $104,900 zone after failing to build momentum above the $106,200 Fibonacci 0.5 retracement level. Price action remains broadly supported along the ascending trendline and the 23.6% Fib at $104,800, yet repeated rejection from the descending resistance trendline underscores growing indecision in the market. Despite a prior rally off sub-$103,500 lows, BTC has struggled to extend gains, suggesting the bullish impulse is beginning to stall.
Momentum indicators offer a mixed technical picture. The Relative Strength Index (RSI) is currently tracking just below the neutral 50 level at 45, reflecting muted bullish sentiment and declining momentum. Simultaneously, the MACD shows a persistent bearish bias, with the MACD line below the signal line and both trending beneath the zero axis. This bearish alignment signals underlying selling pressure, despite BTC holding near key structural support.
The 50-period SMA has flattened, while the 100- and 200-period SMAs remain above current price levels, reinforcing the view that bulls face a stiff overhead barrier. Unless BTC can achieve a decisive break above $106,200 and challenge the descending trendline resistance, upside potential remains capped. Failure to hold the $104,800 support region may open the door for a deeper retracement toward $103,500, with a broader correction possible if bearish momentum intensifies. Price reaction near this consolidation apex will be critical in determining the next directional breakout.
Resistance Levels: 105,600, 106,200
Support Levels: 104,800, 103,500
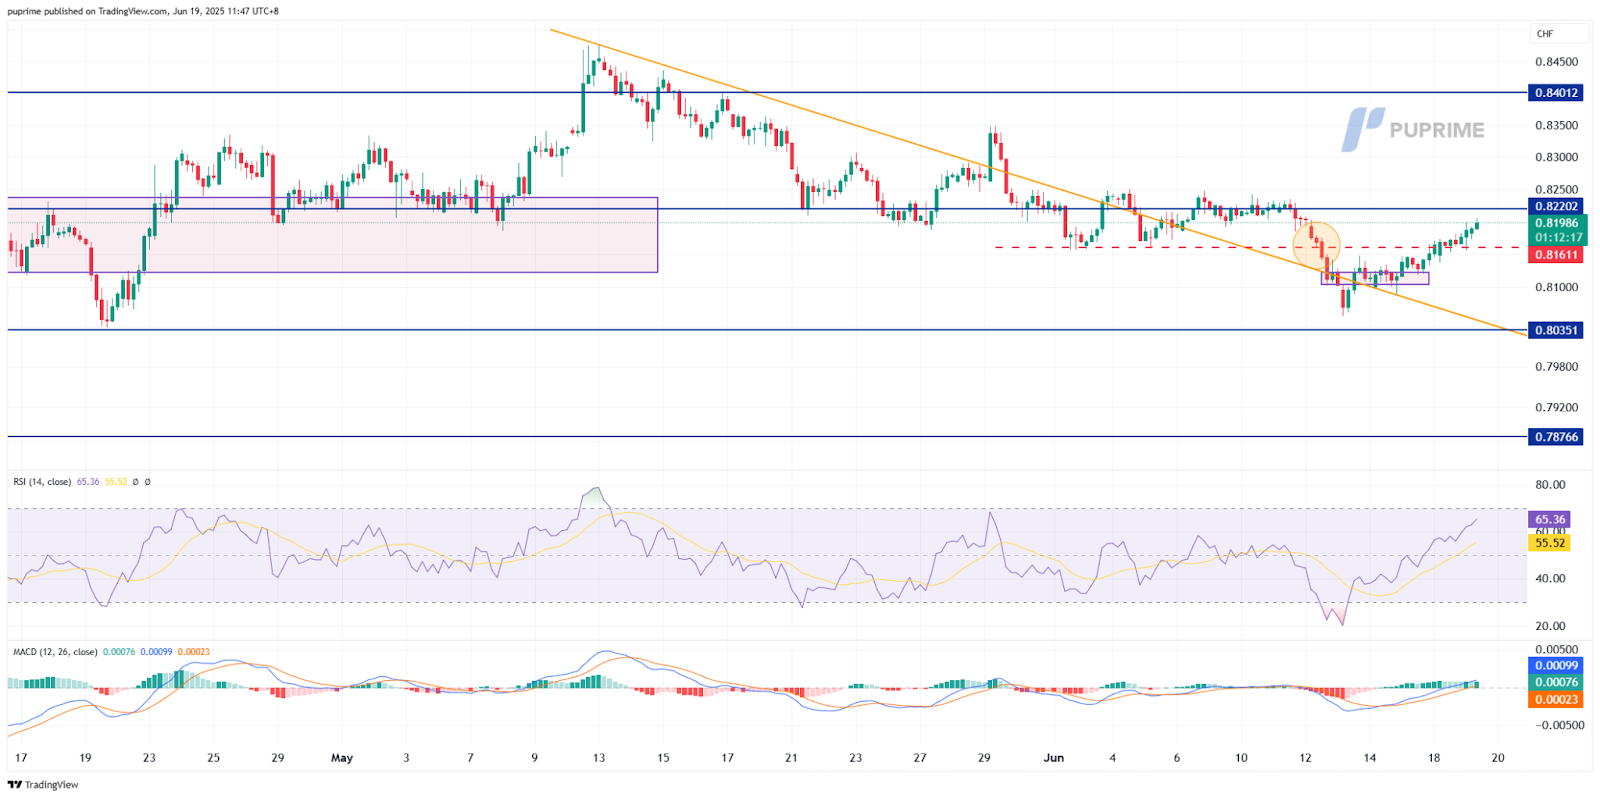
USDCHF, H4
USD/CHF continues to recover from recent lows, trading just below the key $0.8220 resistance zone after reclaiming ground above the previously broken descending trendline. Price action has shifted from a bearish bias to a tentative recovery structure, with bulls now testing a prior support-turned-resistance level. While the pair has managed to reclaim the $0.8160 zone following a brief breakdown, price remains trapped between well-defined horizontal levels, suggesting a cautiously constructive tone but limited conviction.
Momentum indicators are tilting in favor of the bulls. The Relative Strength Index (RSI) has climbed decisively above the 50 mark to 65, indicating growing bullish momentum, though it approaches overbought territory, which may curb near-term upside. The MACD has also confirmed a bullish crossover, with the MACD line nudging above the signal line and histogram bars turning positive, signaling an improving technical backdrop that supports the recent upside breakout.
From a structural standpoint, USD/CHF faces an inflection point. A confirmed breakout above $0.8220 could extend bullish momentum and expose the next resistance near the $0.8400 handle. Conversely, failure to gain follow-through beyond this threshold risks a pullback toward initial support at $0.8160, with stronger support resting near $0.8035. How price reacts around this resistance cluster will be critical in determining whether bulls can reclaim control or if the recent rebound fades into another failed rally.
Resistance Levels: 0.8220, 0.8400
Support Levels: 0.8160, 0.8035

Tradez le Forex, les indices, Métaux et plus encore avec des spreads faibles et une exécution ultra-rapide.
Inscrivez-vous pour un compte réel PU Prime grâce à notre procédure simplifiée.
Approvisionnez facilement votre compte grâce à un large éventail de canaux et de devises acceptées.
Accédez à des centaines d’instruments avec les meilleures conditions de trading.
Plateformes de trading
Apprendre
À propos de PU Prime
Corporatif
