-
- Plateformes de trading
- Application PU Prime
- MetaTrader 5
- MetaTrader 4
- PU Copy Trading
- Trader Web
- PU Social
-
- Conditions de Trading
- Types de compte
- Spreads, Coûts et Swaps
- Dépôts et Retraits
- Frais et Charges
- Heures de Trading

China has executed its most substantial cut on record to the five-year loan prime rate in an effort to stimulate its economy.
China has executed its most substantial cut on record to the five-year loan prime rate in an effort to stimulate its economy. However, the equity markets, including Hang Seng, have not responded positively to the announced stimulus package.
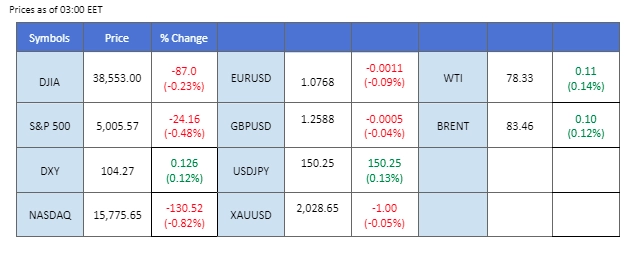
In the U.S. market, all attention is focused on Wednesday’s Nvidia earnings report, crucial for assessing the strength of the tech sector given Nvidia’s significance as a chip giant. Meanwhile, the dollar index remains relatively stable in anticipation of the highly awaited Federal Open Market Committee (FOMC) meeting minutes scheduled for Wednesday. Recent U.S. economic data indicates robust economic performance, potentially influencing the Fed to maintain higher interest rates for an extended period.
In Australia, the Reserve Bank of Australia’s (RBA) monetary meeting minutes revealed considerations for an interest rate hike, but a more cautious approach was favoured, indicating the need for more time to ascertain the direction of inflation. Surprisingly, this hawkish sentiment failed to drive the Australian dollar higher.
Current rate hike bets on 20th March Fed interest rate decision:
Source: CME Fedwatch Tool
0 bps (89.5%) VS -25 bps (10.5%)

(MT4 System Time)
N/A
Source: MQL5

The US Dollar remained flat during a market lull due to US holidays, with investors eagerly anticipating cues from the upcoming FOMC meeting minutes. Despite robust economic indicators bolstering confidence in the US economic outlook, profit-taking activities ahead of the critical FOMC meeting led to a minor retracement in the Dollar. Projections for aggressive Federal Reserve rate cuts witnessed a notable decline, currently standing at approximately 90 basis points for the year, down significantly from earlier forecasts in February.
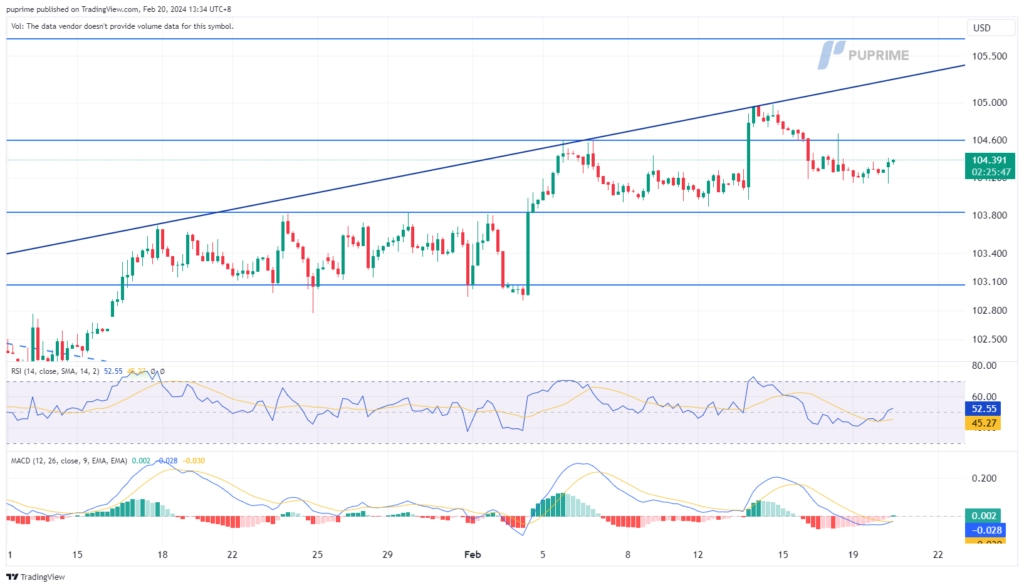
The Dollar Index is trading flat while currently near the resistance level. MACD has illustrated diminishing bearish momentum, while RSI is at 50, suggesting the index might be trading higher after breakout since the RSI rebounded sharply from oversold territory.
Resistance level: 104.60, 105.70
Support level: 103.85, 103.05
Gold prices exhibited a subdued performance in anticipation of the upcoming FOMC meeting minutes. Following a series of robust economic indicators emerging from the US, market sentiment tilts toward expectations of a potentially hawkish stance from the Federal Reserve. This outlook has implications for the US Dollar, gaining strength and exerting pressure on dollar-denominated gold. Despite these headwinds, the precious metal retains some upward potential, as persistent uncertainties in the Middle East amplify its safe-haven appeal.
Gold prices are trading flat while currently testing the support level. MACD has illustrated diminishing bullish momentum, while RSI is at 56, suggesting the commodity might be trading lower after breakout since the RSI stays below the midline.
Resistance level: 2035.00, 2060.00
Support level: 2015.00, 1985.00
The Pound Sterling is currently maintaining its position within a price consolidation range, fluctuating between 1.2540 and 1.2640. The upcoming speech by Bank of England (BoE) Governor Andrew Bailey, scheduled for later today, is anticipated to influence the movement of the pair. Additionally, the highly awaited Federal Open Market Committee (FOMC) meeting minutes, set to be released tomorrow, may also directly impact the pair’s dynamics.
GBP/USD is trading within its price consolidation range but has formed a higher high price pattern. The RSI has been flowing near the 50 level while the MACD hovering near the zero line gives the pair a neutral signal.
Resistance level: 1.2635, 1.2710
Support level:1.2530, 1.2440
The EUR/USD pair is currently positioned in proximity to its resistance level, specifically around 1.0775. The U.S. dollar has experienced a slight uptick in advance of Wednesday’s release of the Federal Open Market Committee (FOMC) meeting minutes. Concurrently, the U.S. long-term treasury yield has reached its recent high at 4.3%, indicating the potential for strength in the U.S. dollar.
EUR/USD is trading relatively flat near its resistance level of near 1.0775. The MACD has crossed above the zero line, but the RSI has been flowing near to the 50 level, suggesting the bullish momentum is easing.
Resistance level: 1.0865, 1.0954
Support level: 1.0700, 1.0630
US equity sentiment continues to thrive, supported by an optimistic outlook from Goldman Sachs. The renowned financial institution revised its year-end target for the S&P 500 upward, citing enhanced profit estimates and stronger-than-anticipated financial performances from major US corporations. With the initiation of the quarterly earnings season, all eyes turn to technology leader Nvidia, particularly given its significant role in the artificial intelligence sector.
S&P 500 is trading higher following the prior breakout above the previous resistance level. However, MACD has illustrated increasing bearish momentum, while RSI is at 63, suggesting the index might experience technical correction since the RSI retreated sharply from overbought territory.
Resistance level: 5115.00, 5535.00
Support level: 4825.00, 4530.00
Following the Lunar New Year hiatus, Chinese equities exhibit resilience, buoyed by positive consumer data revealing increased spending on travel, shopping, and dining compared to the previous year. Official readings over the weekend have ignited hopes for a rebound in Chinese consumer spending, a pivotal driver of economic growth.
HK50 is trading higher while currently testing the resistance level. However, MACD has illustrated diminishing bullish momentum, while RSI is at 56, suggesting the index might experience technical correction since the RSI retreated sharply from overbought territory.
Resistance level: 16270.00, 17180.00
Support level: 15485.00, 14945.00
The Australian dollar has exhibited strength, recording gains over the past four trading sessions. The recently released Reserve Bank of Australia (RBA) monetary policy meeting minutes indicate that board members have contemplated a rate hike but are leaning towards a rate pause, citing a rather gloomy global economic outlook. Additionally, the Chinese government’s decision to cut its five-year loan prime rate in a bid to stimulate its economy is expected to contribute to the buoyancy of the Australian dollar, given its role as a proxy currency for China.
The AUD/USD pair’s bullish momentum seemingly eased near its resistance level at 0.6540. The momentum indicators suggest the bullish momentum may be easing with the RSI eased before reaching the overbought zone, and MACD is on the brink of crossing above the zero line.
Resistance level: 0.6620, 0.6710
Support level: 0.6480, 0.6410
Crude oil prices tread a mixed path, influenced by divergent factors. Positive indicators from China hint at a potential economic recovery, juxtaposed with ongoing geopolitical tensions in the Middle East raising concerns about potential oil supply disruptions. However, the International Energy Agency’s recent warning of a demand slowdown in 2024, coinciding with economic contractions in the UK and Japan, introduces a note of caution in the oil market.
Oil prices are trading higher while currently testing the resistance level. However, MACD has illustrated diminishing bullish momentum, while RSI is at 58, suggesting the commodity might experience technical correction since the RSI retreated sharply from overbought territory.
Resistance level: 78.65, 81.20
Support level: 75.20, 71.35

Tradez le Forex, les indices, Métaux et plus encore avec des spreads faibles et une exécution ultra-rapide.
Inscrivez-vous pour un compte réel PU Prime grâce à notre procédure simplifiée.
Approvisionnez facilement votre compte grâce à un large éventail de canaux et de devises acceptées.
Accédez à des centaines d’instruments avec les meilleures conditions de trading.